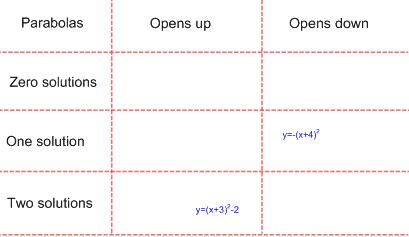
From the department of teaching methods from outside the United States I’ve never heard of before, Carroll Diagrams:

[From this applet. Tip of the hat to Warrington ICT.]
I’ve used something like this before in geometry for sorting triangle types, but I never knew there was a name for it, nor did I think about sorting other math concepts in this way.
I started to brainstorm ways the diagram would work in higher math levels:

I know I’ve done sorting with graphic organizers before, but I don’t recall seeing this particular technique outside of geometry. Perhaps I’m just looking at the wrong textbooks.
Filed under: Education, Mathematics |


Jason,
Carroll diagrams ROCK! I just submitted a paper to Teaching Statistics that use Carroll Diagrams, and I just spent some time in my advanced algebra (high school) teaching Area Proportional Venn Diagrams using Carroll Diagrams.
Although to be honest to Lewis Carroll, he called them “Trilateral Diagrams”. They are finding new life in the medical fields because of the high density of information found in them, especially when the idea of area proportionality comes into play.
If there is interest (heck even if there is not) I will post some of the ideas to my blog this summer.
Jason,
OK, This Blogs for you guy… A Brief History of Logic Diagrams
Thanks!
So you think that calling them Carroll Diagrams is unfair to John Venn? (Certainly before now I’d only thought of them as a modified Venn diagram.)
You could put cos 0 along the top, and sin > 0 and sin < 0 along the side, and sort a bunch of angles, and the quadrants would be consistent with the cartesian plane.
Aaaargh html. You could put cos less than zero and cos greater than zero along the top.
Aren’t these just a type of matrix? They remind me of the ones used in game theory.
This is more a set theory thing since an arbitrary number of elements can appear in each area (also it’s used more a pedagogical and graphic layout tool than as a mathematical structure, even though it has one).
I would definitely argue that it is unfair to Carroll to call them Venn diagrams.
For one thing, a requirement that Venn put on his diagrams to separate them from Euler diagrams or other diagrams floating around at the time was that all the circles must be the same size.
If you are interested in further examples of Carroll’s Bilateral (what is above) and Trilateral diagrams (a much more complicated version of the bilateral) here is the link to the original text (thank you Google!)
http://books.google.com/books?id=b5gXAAAAIAAJ&dq=lewis+carroll+symbolic+logic
Page 21 is the start of the discussion of the bilateral diagram and counters (how he signified the logical relations) while page 39 is the start of the trilateral diagram.
These are able to contain information that can not be represented in a traditional Venn diagram.
For instance, a silly problem could be whether people eat pie, cake, or ice cream on the 4th of July.
Some people like pie only (25), some people like pie and cake (15), pie and not cake (20), or pie and ice cream (10).. Some people like cake only (80) some people like no cake (50), while others like ice cream (95) and not ice cream (35).
Notice that there are 8 different regions in the trilateral diagram, something that is impossible to display in a Venn diagram. A 3 circle Venn can give you 7 regions, with overlap of 3, 2, 2 or 2, while the Carroll can give you 8 regions with an overlap of 3, 2, 2, and 0.
If you want to see the true power of the Carroll diagram, look in this paper:
Edwards, A.W.F., and Edwards, J.H. (1992). Metrical Venn Diagrams. Annual of Human Genetics, 56, 71-75.
Short and sweet, but they show the true power of a modified Carroll to pack a HUGE amount of information into a very small space.
Keen. I’ve definitely never seen a trilateral diagram before in an educational context, or, well, ever really.
I’ll have to mull the possibilities, this may deserve a follow-up post.
I use them to teach area proportional Carroll diagrams in my Advanced Algebra Applications course. They are not difficult to teach, and they get into the quadratic formula, using different areas to build a quadratic equation, etc. They really use fairly high level thinking to do the area proportional aspect.
Perhaps I should write up that lesson in a web format and post about it. They are fairly interesting because of the different nature of the questions / information presented.
How could I use this in algebra 1 ?
Alg 1:
positve/negative slope and positive/negative y-int?
I’m loving this idea for Alg2 though… definitely going to work on some of these.
thanks for sharing!!
Absolute value?
Graph pointing: up/down
Number of x-intercepts: 0, 1, 2